Browser DevTools: Your Automation Mission Control
Welcome to your new mission control center. As a test automation engineer, the Browser Developer Tools – commonly known as DevTools – are not just another feature; they are your single most important utility for understanding the application you're testing. Think of it as the cockpit of a spacecraft, providing all the telemetry, diagnostics, and controls needed to navigate complex missions.
While we've briefly peeked into some of these panels in previous lessons, our goal here is to integrate that knowledge into a professional, systematic workflow. You will learn to move beyond isolated tricks and use DevTools as a cohesive toolkit to diagnose any UI automation problem you might encounter.
Mastering this tool is a non-negotiable skill. Let's power up the console and learn how to see the web the way our automation scripts do. 🚀

The Elements Panel – DOM Command Center
The Elements panel is your live, interactive view of the Document Object Model (DOM). This is not the static source code the server sent; this is the living, breathing document that has been modified by JavaScript and is currently rendered in the browser viewport. Think of it as a surgical tool that lets you dissect the web page layer by layer.
Understanding the DOM Tree Structure
When you open the Elements panel, you're looking at the hierarchical structure of HTML elements as they exist in memory. Every element you see here is a node in the DOM tree, and this structure directly corresponds to what your Selenium or Playwright commands will interact with. The indentation shows parent-child relationships, and the little arrows next to elements indicate they have children that can be expanded or collapsed.
This tree structure is crucial to understand because when you write locators like driver.FindElement(By.CssSelector("div.container > button")), you're navigating this exact hierarchical structure. The Elements panel shows you the reality of what your automation scripts are working with.
Element Selection and Inspection
The most fundamental skill is learning to select elements efficiently. You have several methods at your disposal:
- Inspector Tool: Click the cursor icon in the top-left corner of DevTools (or press Ctrl+Shift+C). This activates "inspect mode" where you can hover over any element on the page and see it highlighted in the DOM tree. When you click an element, it becomes selected in the Elements panel, and all the diagnostic information in the right-hand panels updates to show data about that specific element.
- Direct DOM Navigation: You can also click directly on elements in the DOM tree. This is particularly useful when you need to examine elements that are hidden, have very small click targets, or are generated dynamically by JavaScript.
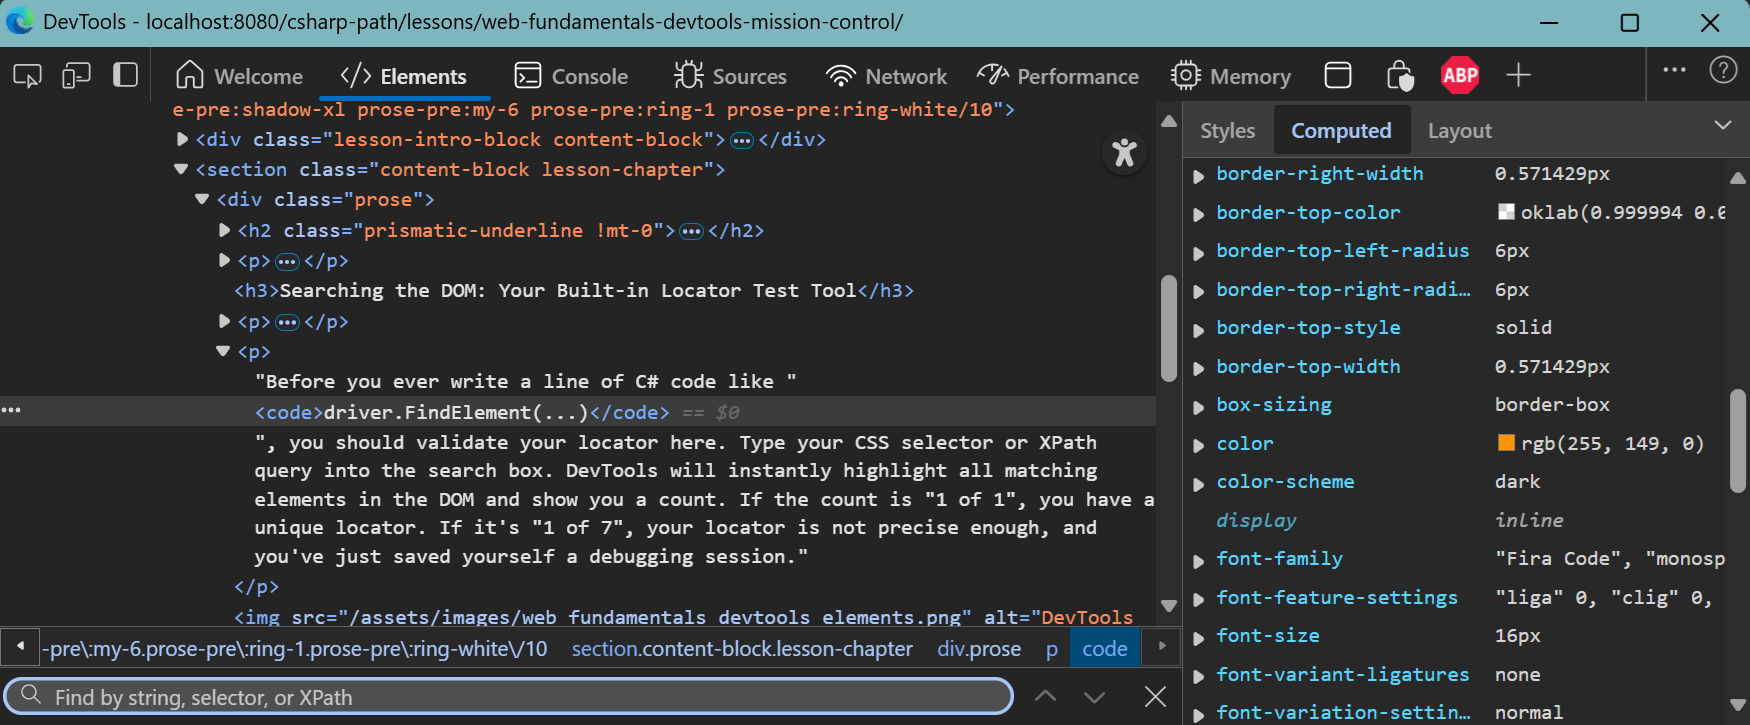
Searching the DOM: Your Built-in Locator Test Tool
One of the most powerful features of the Elements panel is its built-in search functionality. By pressing Ctrl+F (or Cmd+F on Mac), a search bar appears at the bottom of the panel that allows you to find elements by text content, CSS selector, or XPath expression. This is your sandbox for perfecting locators.
Before you ever write a line of C# code like driver.FindElement(...), you should validate your locator here. Type your CSS selector or XPath query into the search box. DevTools will instantly highlight all matching elements in the DOM and show you a count like "1 of 3" at the right side of the search bar. If the count is "1 of 1", you have a unique locator. If it's "1 of 7", your locator is not precise enough, and you've just saved yourself a debugging session.
The Right-Hand Diagnostic Panels
When you select an element in the DOM tree, the right-hand pane transforms into a comprehensive diagnostic hub. These panels work together to give you a complete picture of why an element behaves the way it does:
- Styles Tab: This shows you the CSS cascade in action. You can see every style rule that applies to the element, which stylesheet file it came from, and which rules were overridden by more specific ones. Crossed-out properties indicate they've been superseded by other rules. You can also live-edit CSS here by checking and unchecking boxes or changing values to see how the element reacts in real-time. This is invaluable for understanding why an element might be positioned incorrectly or why it's not visible.
- Computed Tab: This is the final word on styling. After all the complex CSS cascade calculations are complete, this tab shows you the final, calculated value of every CSS property for the selected element. This is the perfect place to check why an element isn't behaving as expected. For example, if your test is failing because it can't click a button, you might find that the button's final computed height and width are both
0px, or that itspointer-eventsproperty is set tonone. - Event Listeners Tab: This tab reveals the JavaScript event handlers attached to the selected element. You can see exactly which functions are bound to events like
click,mouseover,focus, orkeydown. This is incredibly valuable for debugging interactivity issues. If you're wondering what's supposed to happen when you click a button, this tab will show you the exact JavaScript function that should execute. You can even click on the function name to jump directly to the source code. - Properties Tab: This shows you the actual JavaScript object properties of the DOM element. This is particularly useful for debugging form elements, where you can see properties like
value,checked,disabled, andreadonly. When your Selenium test is having trouble interacting with a form field, this tab can reveal the current state of the element's properties.
Live DOM Manipulation
One of the most powerful features for testers is the ability to modify the DOM in real-time. You can right-click on any element in the DOM tree and choose options like "Edit as HTML" to completely rewrite an element's markup, or "Delete element" to remove it entirely. This allows you to test edge cases and simulate different application states without needing to write code or manipulate the application through its normal interface.
Intro to Chrome DevTools
The Console – Command & Control
The Console panel serves as your direct command line interface into the webpage's JavaScript runtime environment. It's simultaneously a logging system, an error reporting center, and an interactive JavaScript interpreter. For test automation engineers, it's an indispensable tool for debugging, experimentation, and understanding application behavior.
Understanding Error Messages and Warnings
The Console automatically captures and displays all JavaScript errors, warnings, and log messages generated by the web application. Learning to read these messages is crucial for effective debugging. Errors appear in red and typically indicate that JavaScript execution has been interrupted, which often means interactive features are broken. Warnings appear in yellow and suggest potential issues that don't necessarily break functionality but might cause problems.
When you see an error like "Uncaught TypeError: Cannot read property 'addEventListener' of null", this tells you that JavaScript code is trying to attach an event listener to an element that doesn't exist yet. This is a common timing issue in dynamic web applications and directly impacts your automation scripts – if the JavaScript is failing to set up event handlers, your WebDriver clicks might not trigger the expected behavior.
Pay special attention to the stack trace that appears below error messages. This shows you the exact sequence of function calls that led to the error, often including file names and line numbers. This information is invaluable when reporting bugs to developers, as it gives them a precise starting point for their investigation.
Interactive JavaScript Execution
The Console provides a JavaScript Read-Eval-Print Loop (REPL) where you can execute JavaScript commands directly within the context of the current page. This means you have access to all the same variables, functions, and DOM elements that the page's own JavaScript code can access. You can test JavaScript snippets, query the DOM, modify element properties, and even simulate user interactions.
The Magic of $0 and Console Shortcuts
Here's a professional tip that will save you countless hours: after you select an element in the Elements panel, switch to the Console and type $0. When you press Enter, the console returns a direct JavaScript object reference to that exact element. This allows you to immediately start interacting with it programmatically.
For example, after selecting a button element, you can type $0.click() to programmatically click it, or $0.textContent to see its text content, or $0.disabled = true to disable it. This is incredibly useful for testing different element states and understanding how your automation scripts should interact with elements.
The Console also provides several other useful shortcuts: $1, $2, $3, and $4 reference the previously selected elements, allowing you to work with multiple elements simultaneously. As we've learned, the $$("selector") function returns an array of all elements matching the given CSS selector, which is perfect for validating locators that should match multiple elements.
Network-Related Console Messages
The Console also displays network-related messages, including failed HTTP requests, CORS errors, and mixed content warnings. These messages often explain why certain features aren't working. For example, if an API call fails due to a CORS policy, you'll see a detailed error message in the Console that explains exactly what went wrong.
Console Overview
Network Panel – Communications Hub
Modern web applications are essentially distributed systems that rely heavily on network communication. The Network panel provides a comprehensive view of every single network request made by the web page, from the initial HTML document to images, stylesheets, JavaScript files, and API calls. For test automation engineers, this panel is crucial for understanding the full picture of how an application behaves and why certain features might be failing.
Understanding the Network Timeline
When you load a page with the Network panel open, you'll see a waterfall chart that shows every network request in chronological order. Each request is represented as a horizontal bar, where the length of the bar indicates how long the request took to complete. This visualization helps you understand the loading sequence and identify performance bottlenecks that might affect your automation scripts.
The waterfall chart reveals important timing information: DNS resolution, connection establishment, time to first byte (TTFB), and content download. Understanding these phases helps you write more robust automation scripts. For example, if you see that API calls consistently take 2-3 seconds to complete, you know that your WebDriver waits need to account for this delay.
Filtering and Organizing Network Activity
The Network panel provides powerful filtering options that help you focus on specific types of requests. The filter buttons at the top allow you to show only certain types of resources:
- XHR/Fetch Filter: This isolates the dynamic API calls that power modern single-page applications. These are the requests that happen after the initial page load, triggered by user interactions or automatic updates. By filtering to show only XHR/Fetch requests, you can see exactly what data is being requested and received when you interact with the application.
- JS Filter: Shows only JavaScript files being loaded. This is useful for understanding the application's architecture and identifying if JavaScript loading failures are causing functionality issues.
- CSS Filter: Displays only stylesheet requests, which is helpful for debugging styling issues that might affect element visibility or positioning.
- Images Filter: Shows only image requests, useful for understanding why certain images might not be loading or are loading slowly.
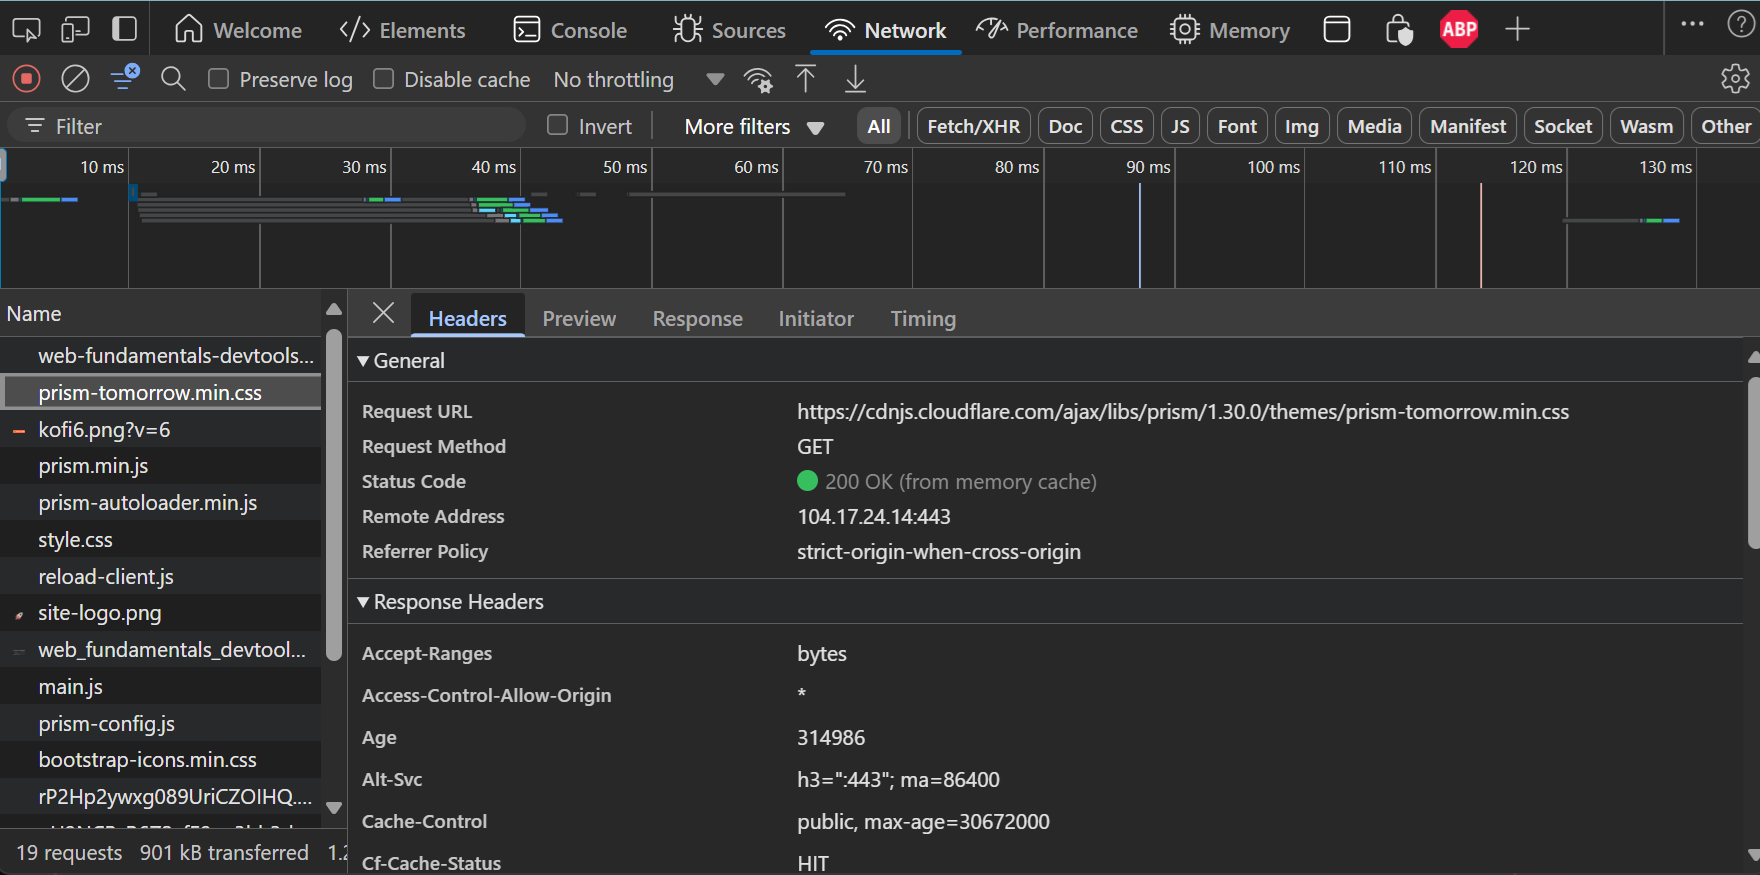
Inspecting Individual Network Requests
Clicking on any request in the Network panel opens a detailed view with multiple tabs containing comprehensive information about that specific request:
- Headers Tab: This shows the complete HTTP conversation between the browser and server. You can see the request URL, HTTP method (
GET,POST,PUT,DELETE), status code, and all request and response headers. This is crucial for debugging authentication issues, CORS problems, and API errors. For example, if your test is failing because a user isn't properly authenticated, you can check theAuthorizationheader to see if the authentication token is being sent correctly. - Payload Tab: For
POSTorPUTrequests, this tab shows you the exact JSON body that was sent to the server. You can verify your application is sending the correct data. - Preview Tab: For responses containing structured data like JSON, this tab provides a formatted, collapsible view of the response content. This is much easier to read than raw JSON and allows you to quickly understand the structure and content of API responses.
- Response Tab: Shows the raw response body exactly as it was received from the server. This is essential for debugging API issues – if the UI isn't displaying the expected data, you can check here to see if the server actually sent the correct data.
- Timing Tab: Provides a detailed breakdown of how long each phase of the request took. This helps identify whether slowness is due to network latency, server processing time, or content download speed.
Analyzing Resource Loading Performance
The Network panel helps you understand why pages might load slowly or why certain features are delayed. Large JavaScript files, unoptimized images, or slow API responses all impact user experience and can affect your automation scripts. If your tests are experiencing timeouts, the Network panel can reveal whether the issue is on the client side (slow resource loading) or server side (slow API responses).
Pay attention to the status codes of network requests. A 200 OK status indicates success, while 404 Not Found means a resource is missing, 500 Internal Server Error indicates a server-side problem, and 401 Unauthorized suggests authentication issues. These status codes often explain why certain features aren't working as expected.
Simulating Network Conditions
One of the most valuable features for testers is network throttling. The Network panel includes a dropdown menu that allows you to simulate different network conditions, from "Fast 3G" to "Slow 3G" to "Offline". This is incredibly useful for testing how your application behaves under less-than-ideal network conditions.
When you throttle the network, you can observe how loading spinners behave, whether buttons are properly disabled during API calls, and how the application handles slow or failed network requests. This helps you write more robust automation scripts that can handle the real-world variability of network performance.
Debugging API Integration Issues
For modern web applications, API calls are the backbone of functionality. The Network panel is your primary tool for debugging API integration issues. If a feature isn't working, you can filter to show only XHR/Fetch requests and see exactly what API calls are being made when you interact with the application.
Common issues you can identify include: API calls that never get sent (indicating JavaScript errors), calls that return error status codes (indicating server-side problems), calls that take too long (indicating performance issues), and calls that return unexpected data (indicating API changes or bugs).
Inspect Network Activity - Chrome DevTools 101
Application Panel – Storage and State Management
The Application panel provides comprehensive access to all the ways that web applications store data and maintain state in the browser. Modern web applications use various storage mechanisms to persist user preferences, cache data, maintain authentication state, and improve performance. Understanding these storage mechanisms is crucial for test automation engineers who need to control application state and simulate different user scenarios.
Understanding Browser Storage Types
Web applications have access to several different storage mechanisms, each with its own characteristics and use cases. The Application panel provides a unified interface for inspecting and manipulating all of these storage types.
Local Storage vs Session Storage
Both Local Storage and Session Storage are simple key-value stores that allow applications to store string data in the browser, but they differ in their persistence characteristics:
Local Storage: Data stored here persists even after the browser is closed and reopened. It's scoped to the origin (protocol + domain + port) and is available to all tabs and windows from the same origin. Applications commonly use Local Storage for user preferences, authentication tokens, or cached data that should persist across sessions. The data remains until it's explicitly cleared by the application, the user clears their browser data, or the storage quota is exceeded.
Session Storage: Data stored here is tied to the specific browser tab and is cleared when the tab is closed. It's useful for temporary data that should only exist for the duration of a user session, such as form data that hasn't been submitted yet or temporary state that shouldn't persist between sessions.
From a testing perspective, you can view, edit, and delete entries in both storage types. This is incredibly powerful for testing different application states. For example, you can manually set a user preference in Local Storage to test how the application behaves with that setting, or you can clear authentication tokens to test the application's logged-out state.
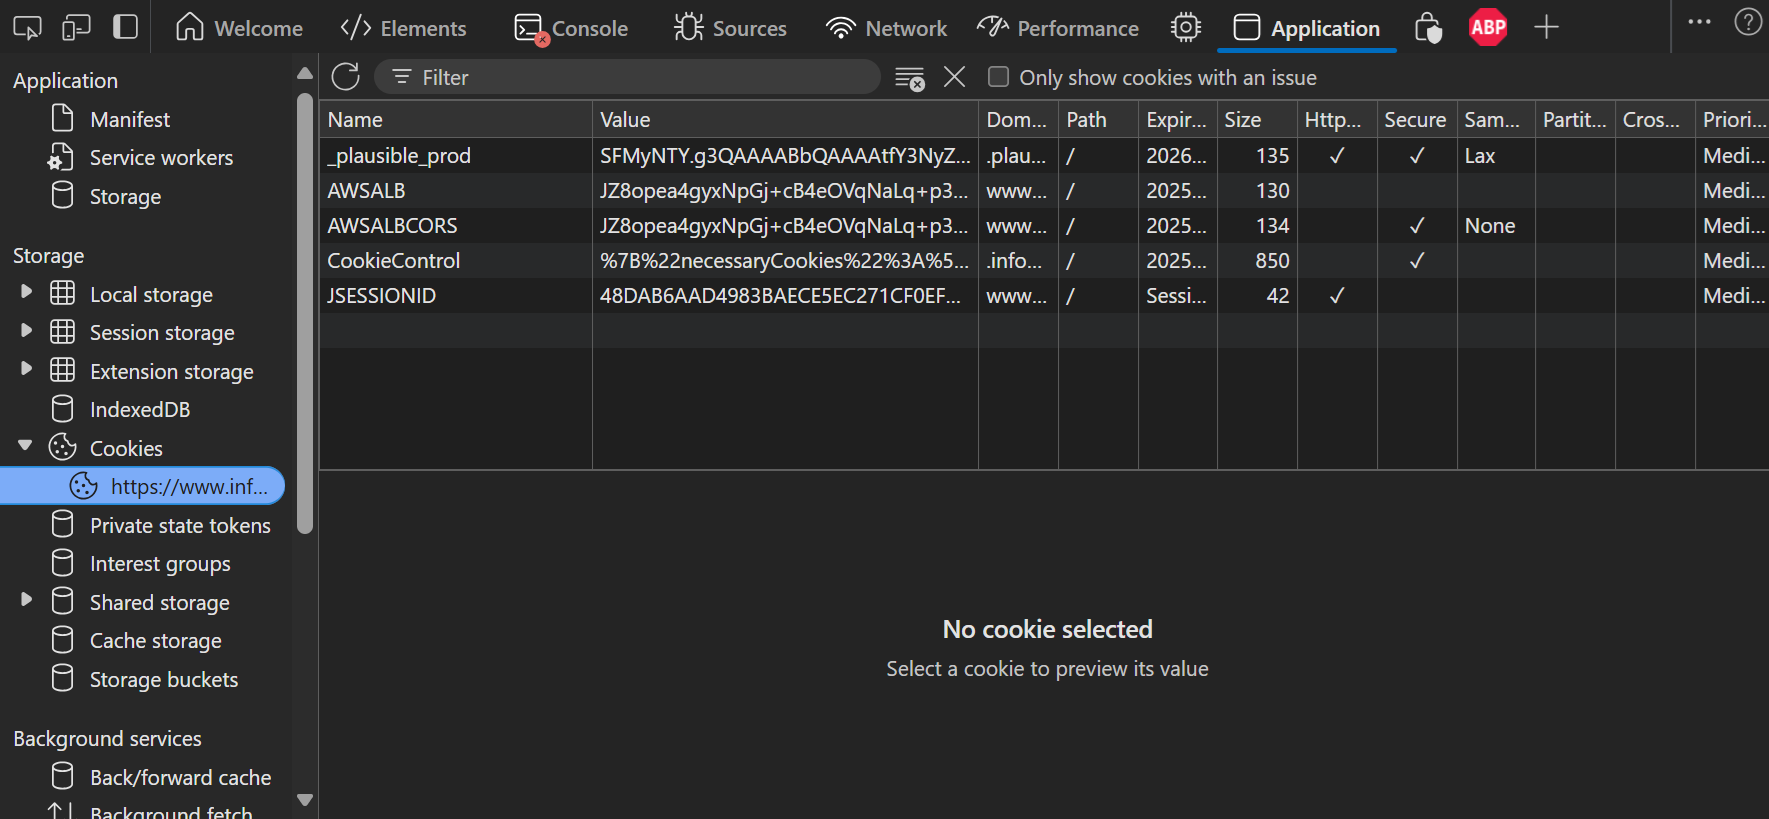
Cookies: The Original Web Storage
Cookies are the oldest form of web storage and are still widely used, especially for session management and authentication. Unlike Local Storage and Session Storage, cookies are automatically sent with every HTTP request to the server, making them suitable for server-side authentication and tracking.
The Application panel allows you to inspect all cookies for the current domain, including their values, expiration dates, security flags, and scope. You can see whether a cookie is marked as HttpOnly (meaning it can't be accessed by JavaScript), Secure (meaning it's only sent over HTTPS), or SameSite (controlling cross-site request behavior).
A common testing technique is to clear all cookies to instantly log a user out and test the application's behavior for a "first-time visit" or unauthenticated user. You can also modify cookie values to test different user roles or permissions.
IndexedDB: Client-Side Database
IndexedDB is a full-featured, NoSQL database that runs in the browser. It's used by applications that need to store large amounts of structured data on the client side, such as offline-capable apps, games, or applications with complex data models.
The Application panel provides a browser for IndexedDB stores, allowing you to inspect the database schema, view stored data, and understand how the application structures its client-side data. This is particularly useful for testing offline functionality or debugging data synchronization issues.
Cache Storage: Service Worker Caches
Modern web applications often use Service Workers to implement offline functionality and improve performance through caching. The Cache Storage section shows you all the caches created by Service Workers, including their contents and sizes.
Understanding what's cached can help you debug issues related to outdated content or offline functionality. You can also clear specific caches to test how the application behaves when it needs to fetch fresh data from the network.
View and Edit Local Storage
AI-Powered DevTools – The Future of Debugging
Modern browsers are beginning to integrate artificial intelligence features directly into DevTools, representing a significant evolution in how developers and testers interact with web applications. These AI-powered features can help you understand complex issues, generate code snippets, and even suggest solutions to common problems.
Copilot Assistance in Edge DevTools
Starting with Microsoft Edge version 120+, Copilot is directly integrated into DevTools to help you understand and debug web pages more effectively. This AI-powered feature brings contextual insights right to where developers face challenges: the Console and Sources panels.
How to Use
- Console: Click the Copilot button next to any error or warning to ask for a detailed explanation.
- Sources: Select a snippet of code, right-click, and choose "Copilot: Explain these lines of code" for insight into what the code does.
When triggered, Copilot opens in the Edge sidebar and starts a context-aware conversation about the selected issue or code.
Use Cases
- Error Explanation: Get clear, actionable explanations for cryptic runtime errors and warnings.
- Code Understanding: Learn what unfamiliar code snippets do and how they behave in the context of your page.
- Learning in the Flow: Stay focused on your task without jumping to external search engines – Copilot provides answers inline.
AI Assistance in Chrome DevTools
The AI Assistance panel in Chrome DevTools allows you to chat directly with Gemini – Google's AI model – about the technical details of the web page you're inspecting.
Conversations launched from this panel automatically include context from the inspected page, helping you debug, explore, and understand its behavior more effectively.
How to Use
You can start with built-in example prompts or ask your own technical questions. The conversation continues naturally with follow-ups as needed to complete your task.
Use Cases
- Styling: Ask about specific DOM elements to understand how CSS rules affect their display, layout interactions, and resolve styling challenges with suggested fixes.
- Network Requests: Investigate requests within your page. Learn where they originate, how long they take, and troubleshoot failed or delayed responses.
- Sources: Get insight into JavaScript and asset files loaded by the page. Understand their purpose and contents.
- Performance: Analyze recorded activity from the Performance panel. Ask about paint timings, scripting overhead, and receive actionable recommendations for speed improvements.
While these AI features are still emerging and evolving, they represent an exciting direction for the future of web development and testing tools. As a test automation engineer, staying aware of these developments can help you leverage new capabilities as they become available.
Enable AI assistance in DevTools
The Ultimate Debugging Workflow
The true power of DevTools comes from using all the panels together in a systematic approach to diagnose problems. Rather than randomly clicking through panels, professional test automation engineers follow a structured workflow that efficiently narrows down the root cause of any issue.
Case Study: The Unresponsive "Save Profile" Button
The Scenario: Your automated test clicks a "Save Profile" button using driver.FindElement(By.Id("save-profile-btn")).Click(). The click command itself doesn't throw any exceptions, but your next step, which uses WebDriverWait to assert that a "Profile Saved!" success message appears, times out and fails with a TimeoutException. What do you do?
The Professional's Debugging Workflow:
- Step 1: Reproduce and Check the Console - First, perform the action manually with DevTools open and the Console panel visible. The moment you click the button, watch for any red error messages. A JavaScript error could be crashing the save function before it can display the success message. Look for errors like "Cannot read property 'value' of null" or "TypeError: saveProfile is not a function". These errors indicate that the JavaScript code responsible for handling the button click is failing.
- Step 2: Inspect the Network Activity - If there are no console errors, immediately switch to the Network panel (with the Fetch/XHR filter active). Clear the network log, then click the button again. Was an API call sent to the server? If not, the button's event listener may be broken or the save function may not be making the expected network request. If a call was sent, examine the status code. A
500 Internal Server Errorwould explain why the UI isn't showing a success message. Check the Response tab for a detailed error message from the server. - Step 3: Examine the DOM and Styling - If the network call returned a
200 OKstatus, the problem is likely in the UI rendering code. Use the Elements panel to search for the success message element. Is it being added to the DOM but hidden by CSS rules? Select the message element and check the Computed tab for properties likedisplay: none,visibility: hidden,opacity: 0, orheight: 0. Also check if the element is positioned off-screen with properties likeleft: -9999px. - Step 4: Verify Event Listeners - As a final diagnostic step, inspect the button element in the Elements panel and examine the Event Listeners tab. Is there actually a
clickevent handler attached to the button? If not, the button might be broken at the most fundamental level. If there is a handler, you can click on it to view the JavaScript code and understand what should happen when the button is clicked. - Step 5: Check Application State - If all the above steps check out, examine the Application panel to see if the save operation is modifying stored data correctly. Check Local Storage, Session Storage, and cookies to see if the user's profile data is being updated even though the success message isn't appearing.
This systematic approach transforms a vague test failure ("element not found") into a precise diagnosis ("the save API is returning a 500 error because the user's session has expired"). This level of detail is crucial for writing effective bug reports and building robust automation scripts that can handle various error conditions.
Advanced DevTools Techniques for Test Automation
Beyond the fundamental panels we've covered, there are several advanced DevTools techniques that can significantly improve your test automation workflow and debugging capabilities.
Performance Profiling for Test Optimization
The Performance panel can help you understand why certain operations are slow in your application. This is particularly valuable when your automation scripts are experiencing timeouts or when you need to optimize wait strategies.
Device Mode for Mobile Testing
DevTools includes a Device Mode that allows you to simulate mobile devices without needing actual hardware. This is crucial for testing responsive web applications. You can simulate different screen sizes, touch events, and even network conditions that are common on mobile devices. When writing automation scripts that need to work across desktop and mobile, Device Mode helps you understand how elements behave differently on various screen sizes.
Security Panel for HTTPS and Certificate Issues
The Security panel shows you the security state of the current page, including SSL certificate information, mixed content warnings, and security errors. This is particularly important when testing applications that handle sensitive data or when working with staging environments that might have certificate issues.
Accessibility Features
DevTools includes accessibility auditing features that can help you identify elements that might be difficult for assistive technologies to interact with. This is increasingly important as automated testing needs to consider accessibility compliance. The accessibility tree view shows you how screen readers and other assistive technologies interpret your application's structure.
DevTools Recorder
Chrome DevTools includes a Recorder feature that can automatically generate automation scripts based on your interactions with a web page. While these generated scripts often need refinement, they can provide a starting point for creating test scenarios and can help you understand the sequence of actions needed to reproduce complex user workflows.
Custom DevTools Extensions
The DevTools ecosystem includes numerous third-party extensions that can extend functionality for specific testing needs. Extensions exist for frameworks like React, Vue, and Angular that provide specialized debugging capabilities for applications built with these technologies.
Key Takeaways
- Browser DevTools is an integrated suite of debugging tools, not just individual panels. Mastering the workflow between panels is what separates amateur from professional debugging.
- The Elements panel is your window into the live DOM structure. Use its search functionality to validate locators before writing automation code, and leverage the diagnostic panels to understand element behavior.
- The Console provides direct access to the JavaScript runtime and is essential for understanding application errors, testing code snippets, and validating locators interactively.
- The Network panel reveals the complete communication between browser and server. Use it to debug API issues, understand performance characteristics, and simulate different network conditions.
- The Application panel gives you control over all forms of browser storage, enabling you to manipulate application state for testing different scenarios.
- AI-powered DevTools features are emerging and can provide intelligent assistance with debugging, locator generation, and code suggestions.
- This lesson covers the essential DevTools functionality for test automation engineers, but DevTools has many more advanced features and specialized panels that could fill an entire course.
Deepen Your DevTools Mastery
- Chrome DevTools Official Documentation The complete, official guide from Google. An exhaustive resource for every panel and feature.
- Firefox Developer Tools User Docs Excellent documentation for the Firefox DevTools, which have some unique and powerful features, especially for CSS debugging.
- Microsoft Edge DevTools Guide The official guide for the Chromium-based Edge DevTools, which are very similar to Chrome's but with some unique integrations.